EO Charging
EO Charging is an infrastructure company that helps commercial fleets like vans, trucks, buses and cars transition to electric by providing end‑to‑end charging solutions.
As Senior UX/UI Designer at EO Charging, I led the implementation of usage analytics, established customer-driven feedback loops, and guided the migration to a modern design system.
Partnering with cross-functional teams, these UX/UI changes aligned with business objectives and contributed to vehicle registrations growing from 334 to 3,018 in four months (~800%).
Design System
I led the transition from a Material UI component library to a modern, token-driven design system using Tailwind CSS and Next.js, paired with a scalable Figma design system. I defined a shared token architecture for colors, typography, spacing, and states, rebuilding the component library to align design intent with production-ready code while reducing UI inconsistencies and technical debt.
In close collaboration with engineering and product teams, I integrated workflows leveraging Figma MCP, Code Connect, and AI assisted automation to keep design and code in sync. The migration resulted in faster UI development, improved consistency, and a foundation built for scalable growth and automation.
EO Cloud
EO Cloud is EO Charging’s cloud-based charge point management system (CPMS) that serves as a single back-office platform for monitoring, controlling, and optimising EV charging across fleet depots, workplaces, public sites, and other commercial locations, connecting seamlessly to OCPP-compliant AC and DC chargers beyond EO hardware.
 SiteOps & Management
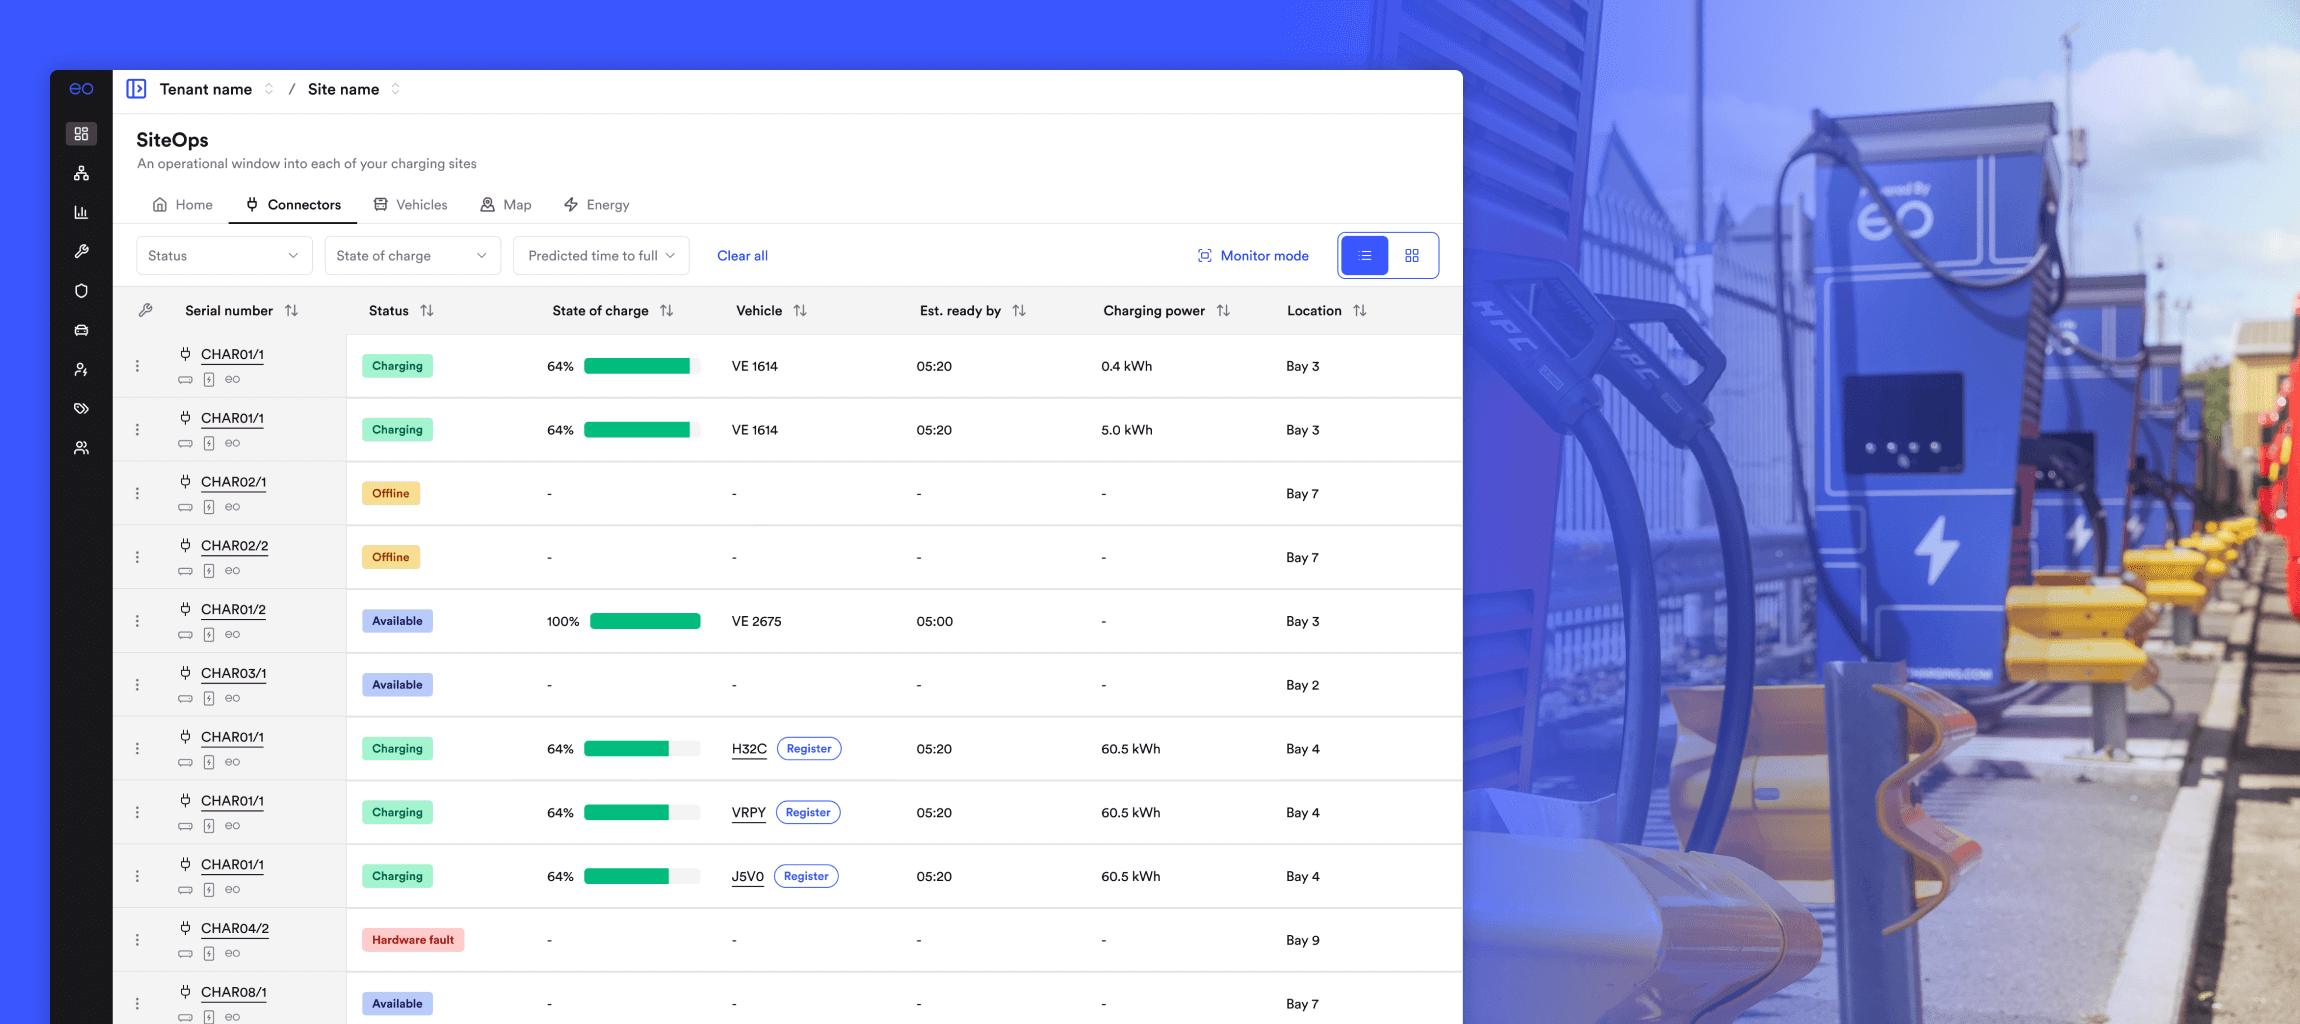
SiteOps was my first major contribution to EO Cloud, shaped directly by customer feedback and designed to elevate the platform to a new operational standard. It introduced a single, consolidated view that provided a 360° overview of a customer’s fleet, site status, and key operational data in one place, reducing friction and improving visibility for day-to-day management. By bringing critical information together on a single page, SiteOps streamlined workflows and set a new baseline for how customers monitored and operated their charging infrastructure.
 Depot dashboard
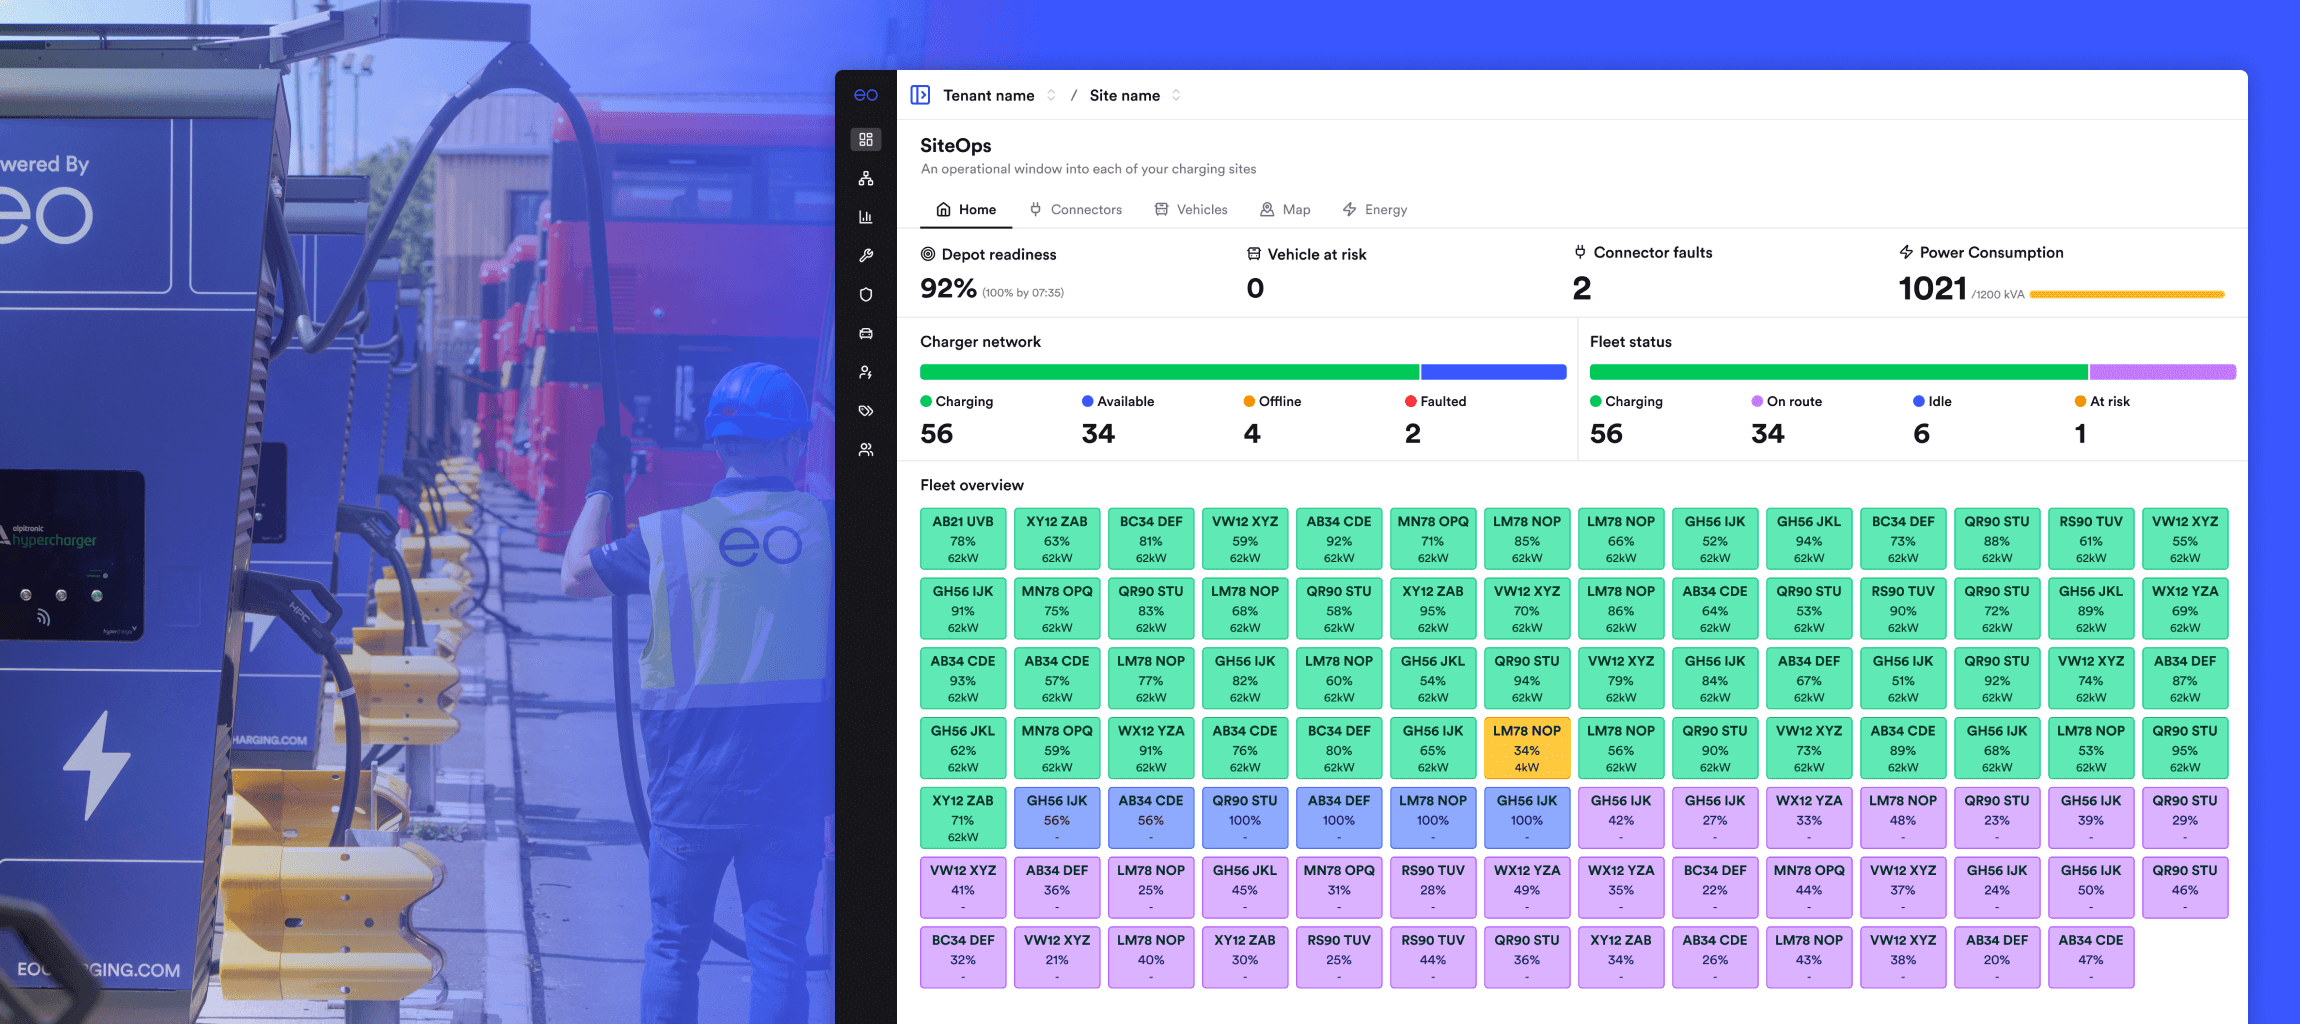
The depot dashboard, introduced as part of the SiteOps home, served as the operational control center, providing real-time visibility into the entire fleet alongside key data on charger status, site readiness, active faults, and power consumption. By centralising critical operational insights in a single view, it enabled faster decision-making and more effective day-to-day management of depot charging operations.
 Incident report and self-healing
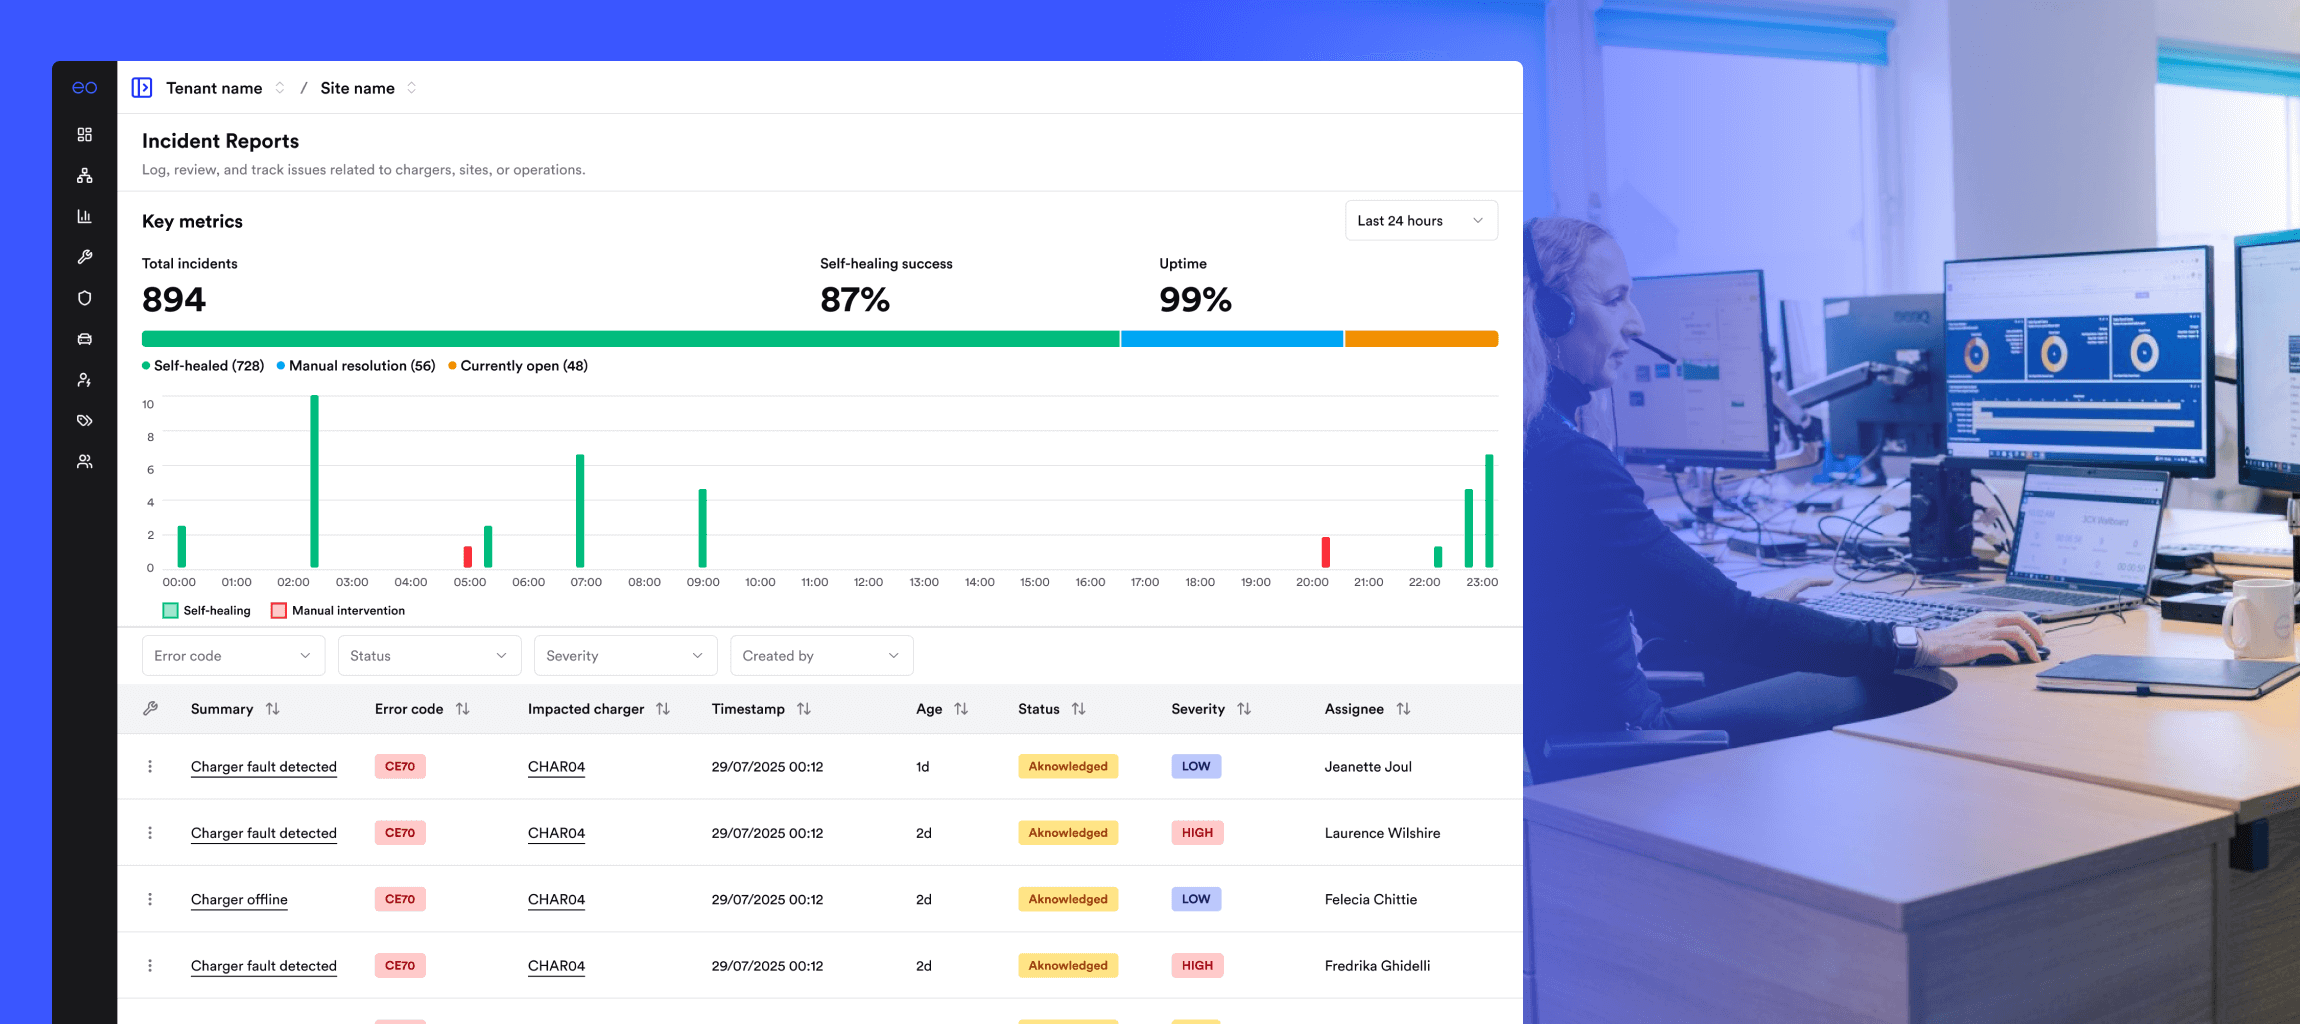
The incident report enabled teams to log, review, and track issues across chargers, sites, and operational workflows, providing clear visibility into recurring and critical problems. It also highlighted the value of the platform’s self-healing functionality, which automatically resolved around 80% of incidents, reducing manual intervention and improving overall system reliability.
 Energy Management Overview
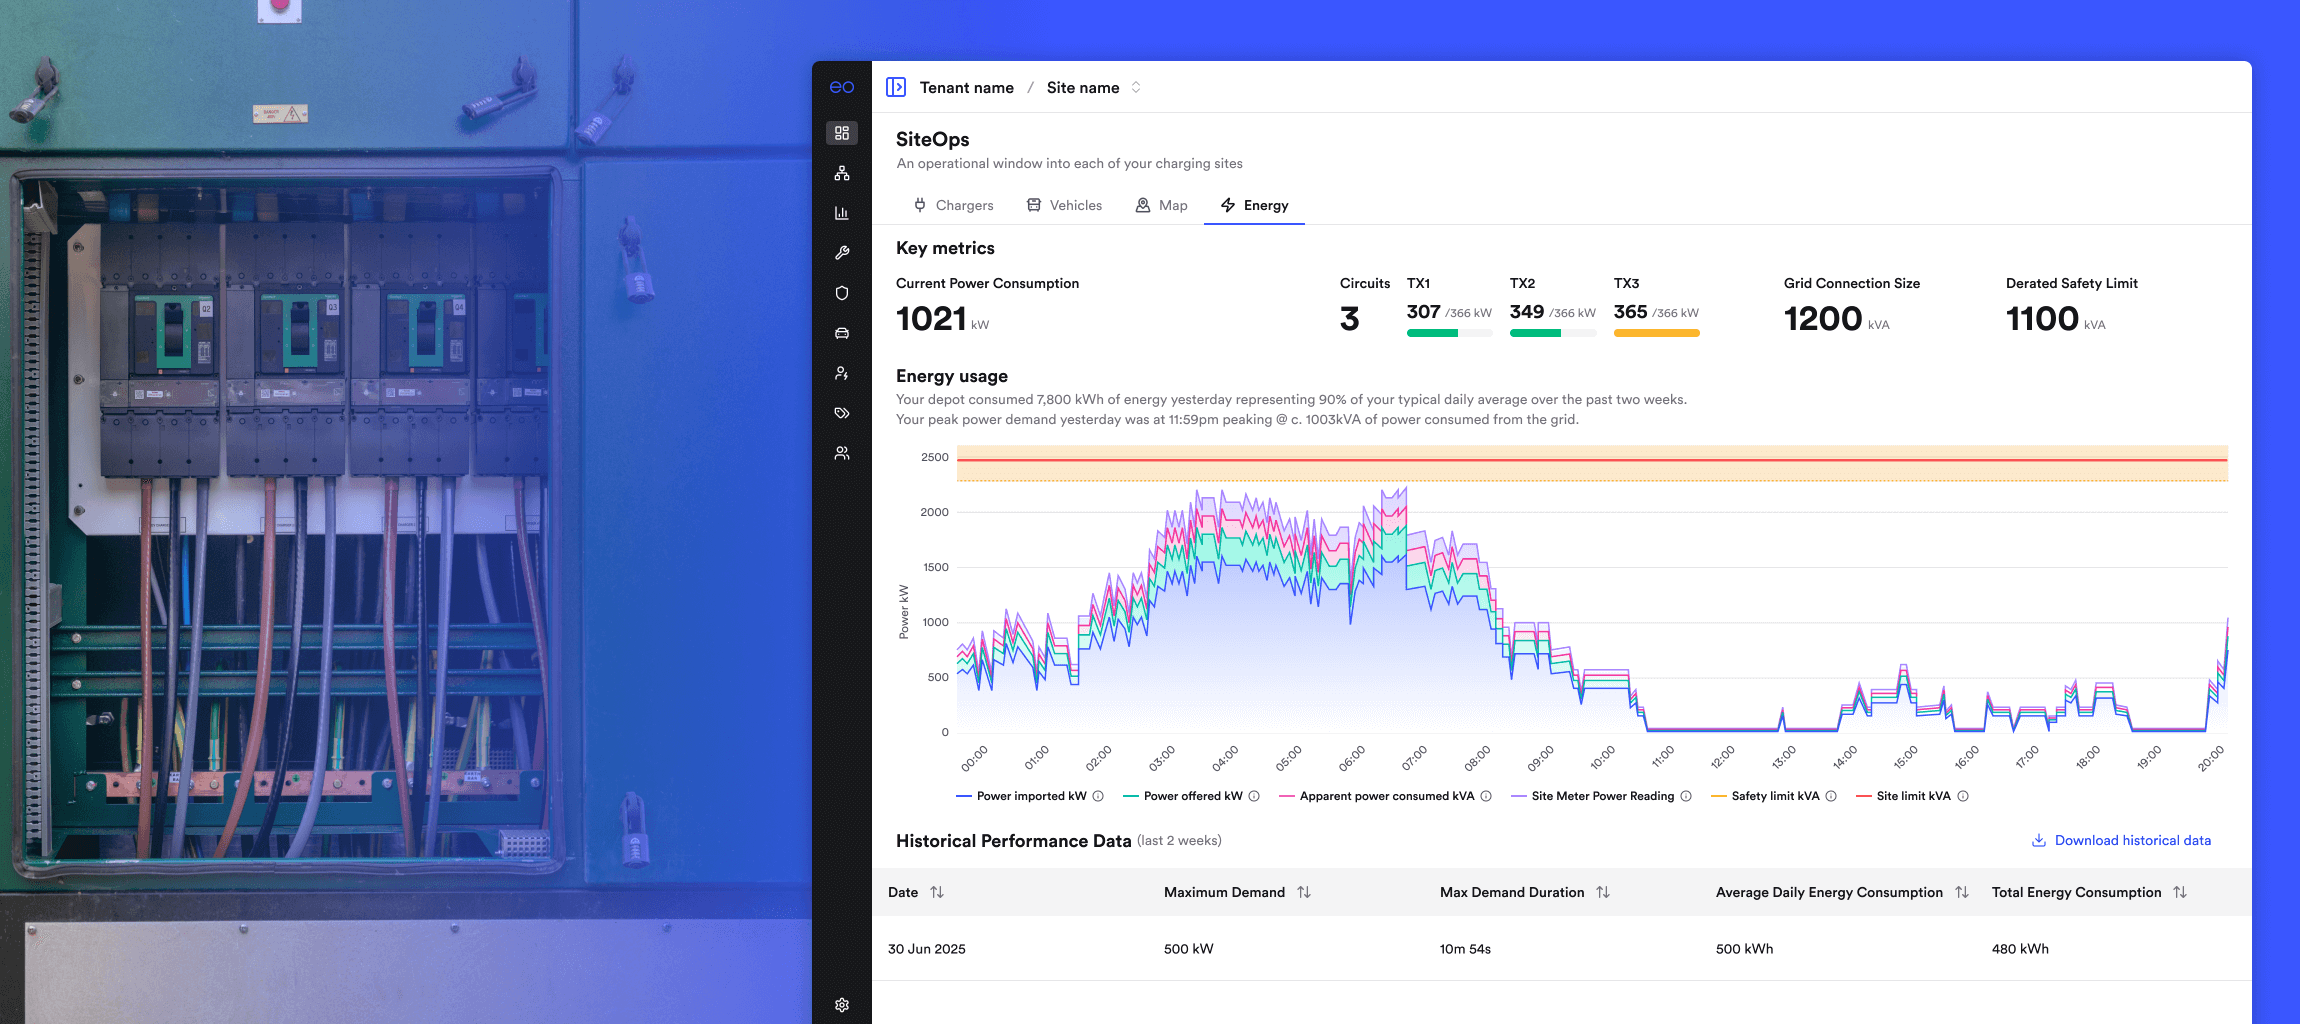
The energy management overview surfaced key insights into energy usage by combining realtime power consumption with a 24 hour visualisation of circuit load, grid capacity, and safety limits. It displayed multiple concurrent metrics such as power imported (kW), power offered (kW), and apparent power consumed (kVA) alongside historical performance data, enabling operators to understand site behaviour, monitor constraints, and make informed energy management decisions.
 Charger Insights
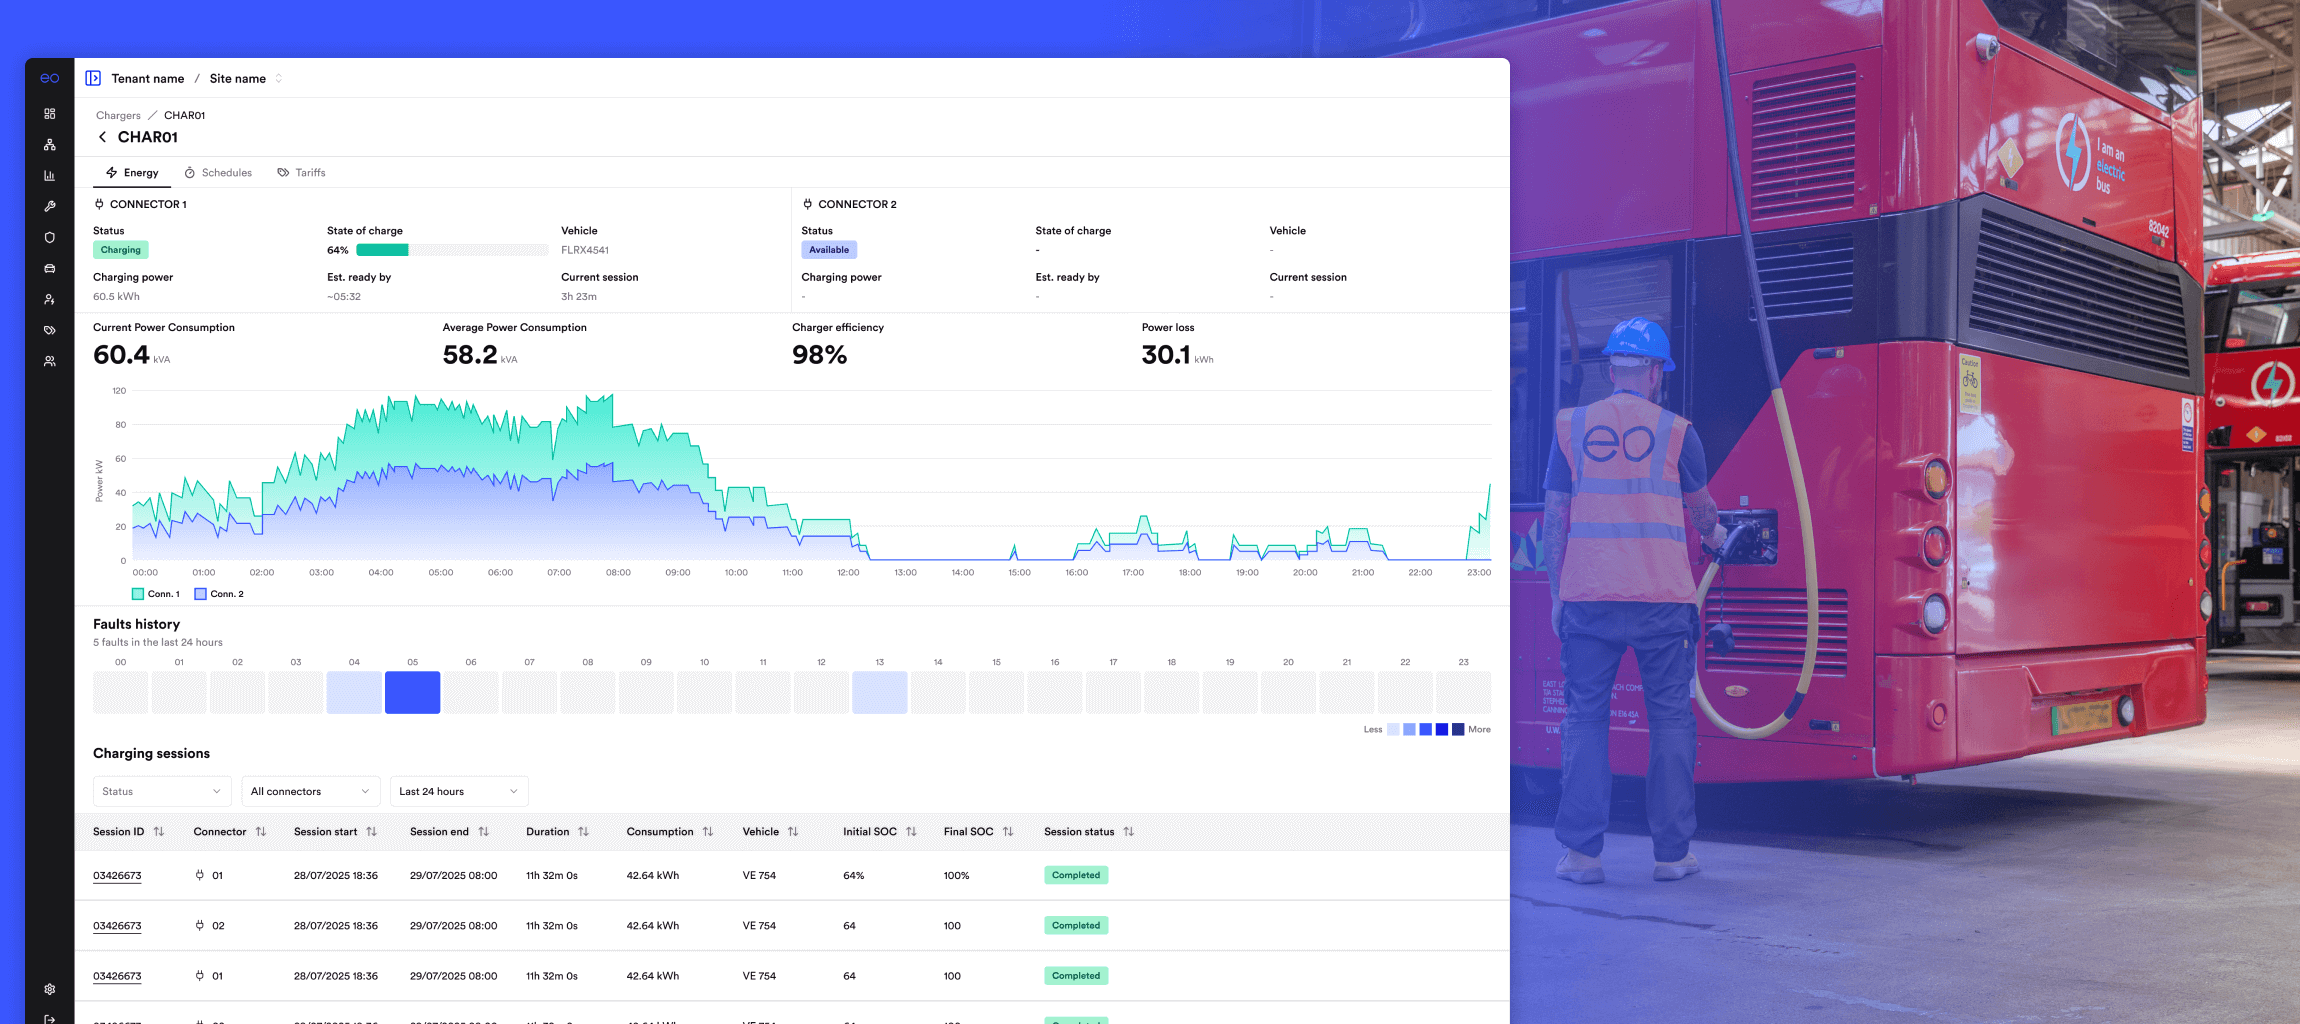
Charger Insights was one of my favourite contributions, bringing together detailed data and visualisations on charger and connector usage into a single, comprehensive view. It combined historical power consumption, fault history, and charging session data, creating a one stop interface for troubleshooting issues, analysing performance, and assessing charger health over time.
EO Charging 2025 - 2026